
A phone app for engineers on site and a web console for the office, connected to the building management systems you already run. See any piece of plant's live values, alarms, history and datasheets – and let the system test it for you.
BMS AR sits alongside your existing supervisors and controllers. Nothing on site has to be replaced.
The server reads your sites through the systems already there – BACnet controllers, enteliWEB, Trend and other data sources – and keeps live values flowing every few seconds.
Points are grouped into plant – AHU 1, Boilers, VT circuit – each with its own six-digit asset tag, limits, part codes and photos, under site and controller.
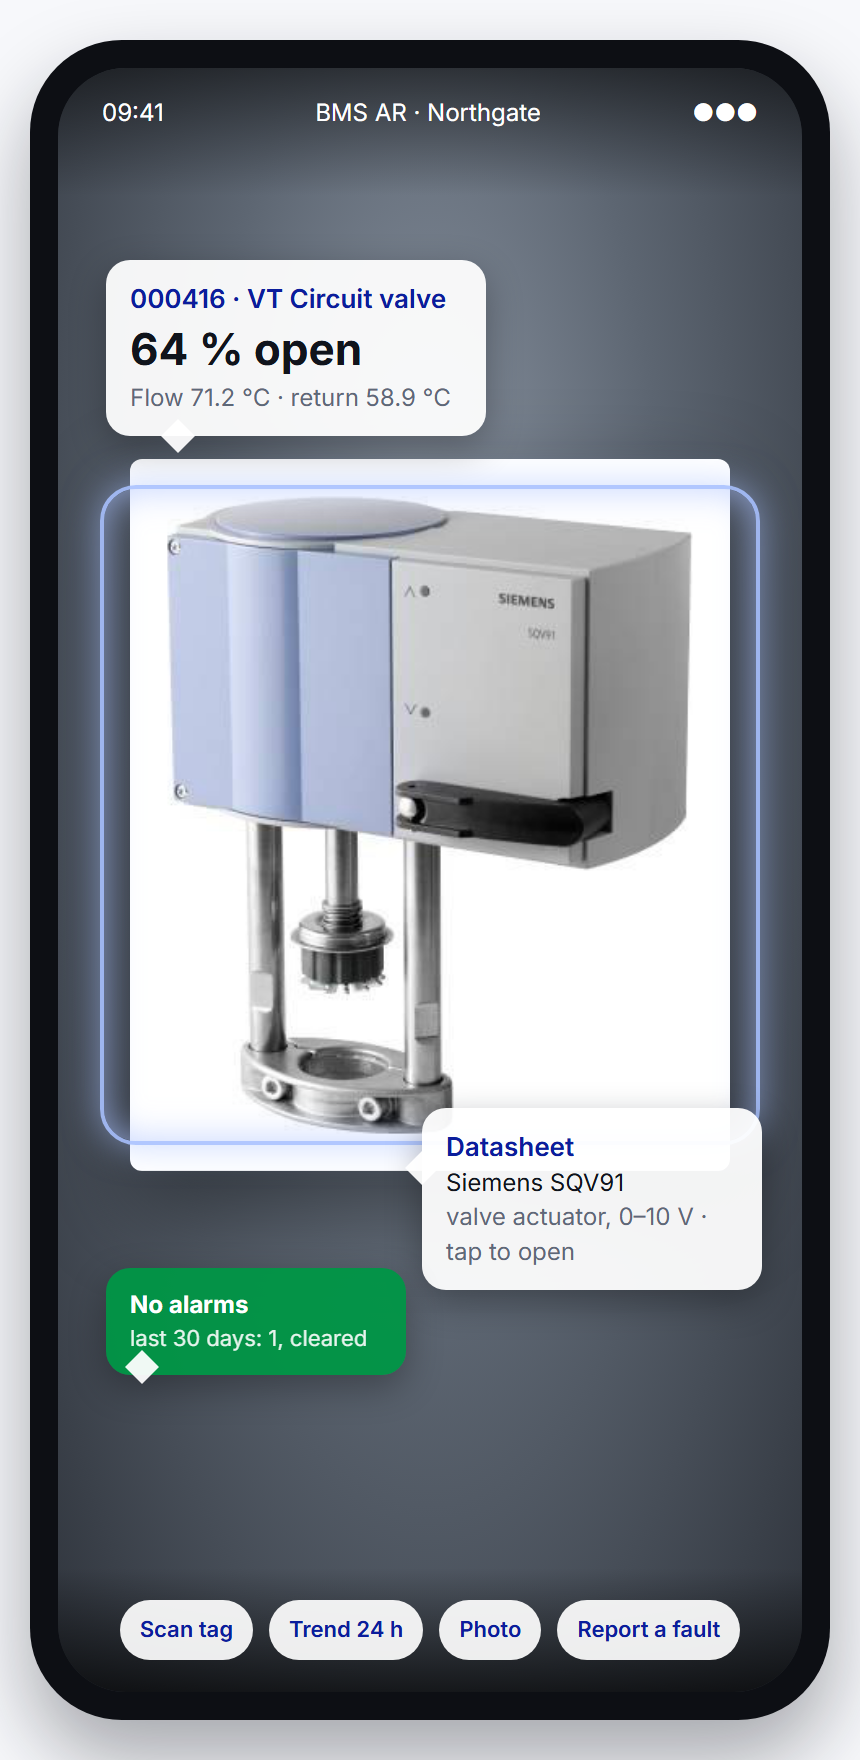
Print a QR label for each item of plant. Scan it with the phone app and that plant's live data opens in place, over the camera view.
Alarms become incidents, faults are reset automatically where it's safe, and Remote PPM proves the plant works – with a report emailed when it's done.
Engineers scan an asset tag and the plant's live readings appear right on it – supply and return temperatures, valve positions, fan states – along with its alarms, a 24-hour trend and the manufacturer's datasheet, one tap away.
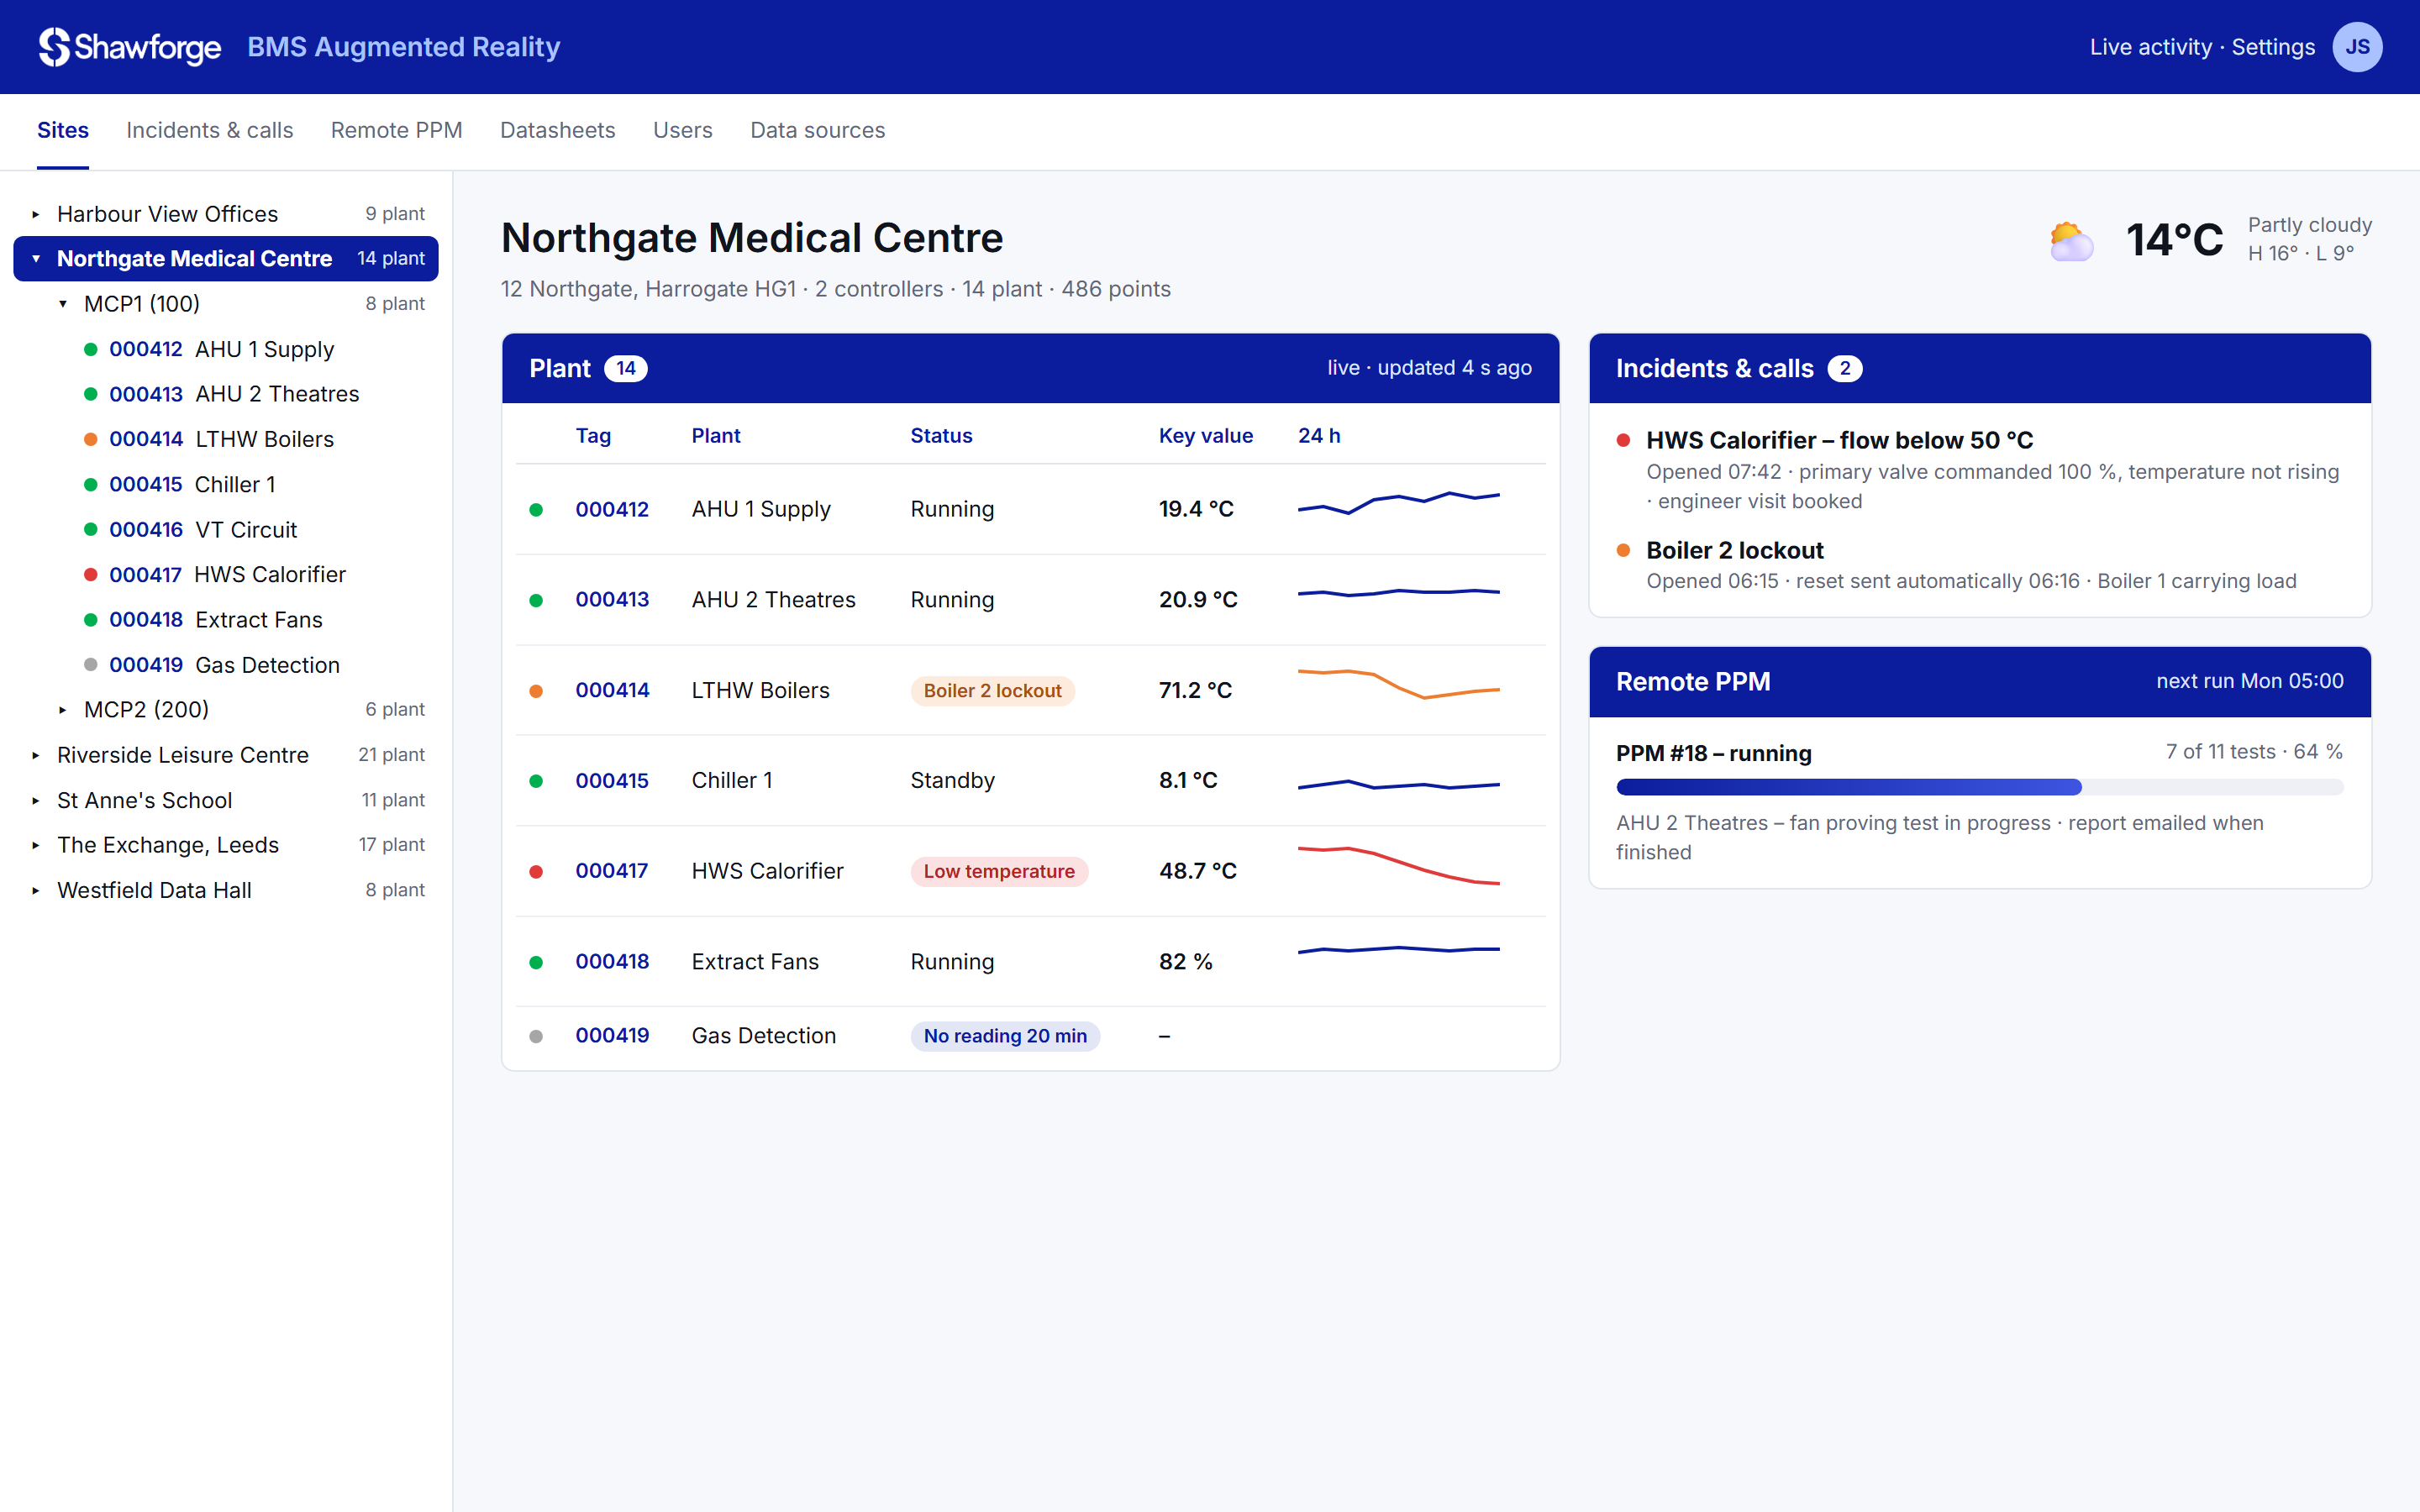
The office sees the whole estate the same way: site, controller, plant, point. Each site shows its plant with live status and key values, open incidents, local weather and the next planned maintenance.
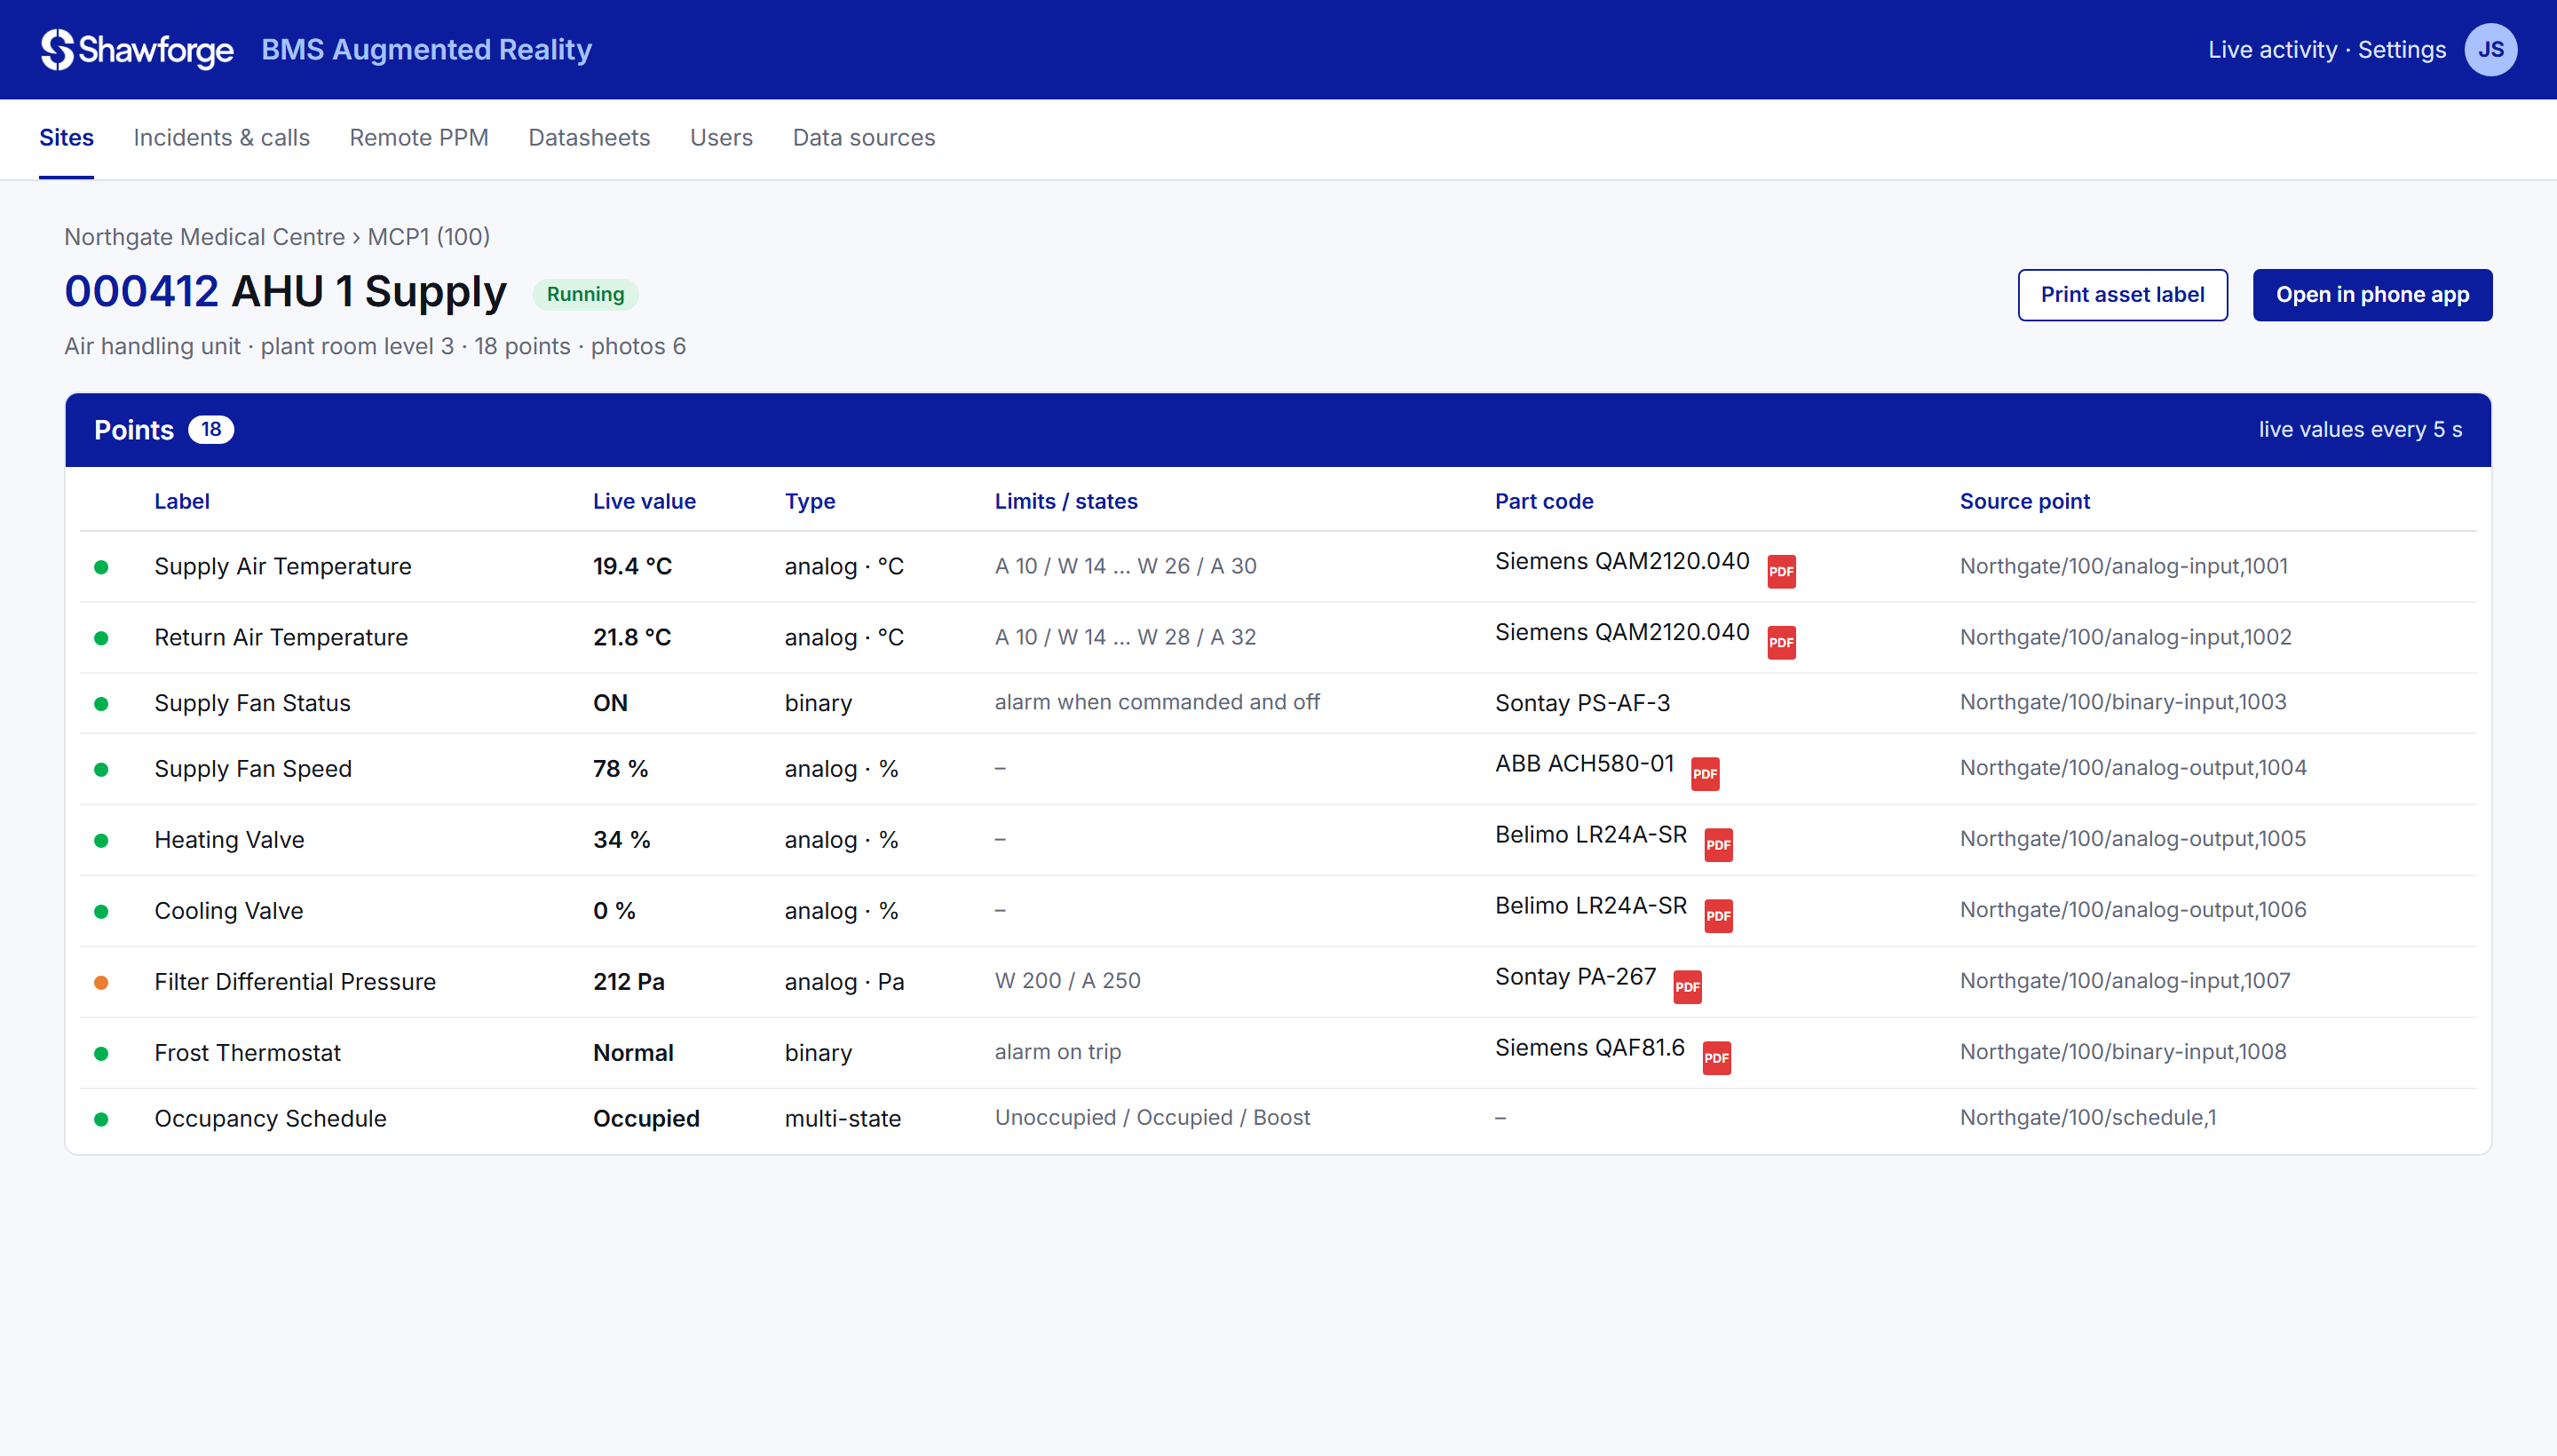
Each item of plant has its asset tag, its points with live values and alarm limits, the part code of every sensor, valve and actuator – linked to the right datasheet – and photos from site, the right way up.
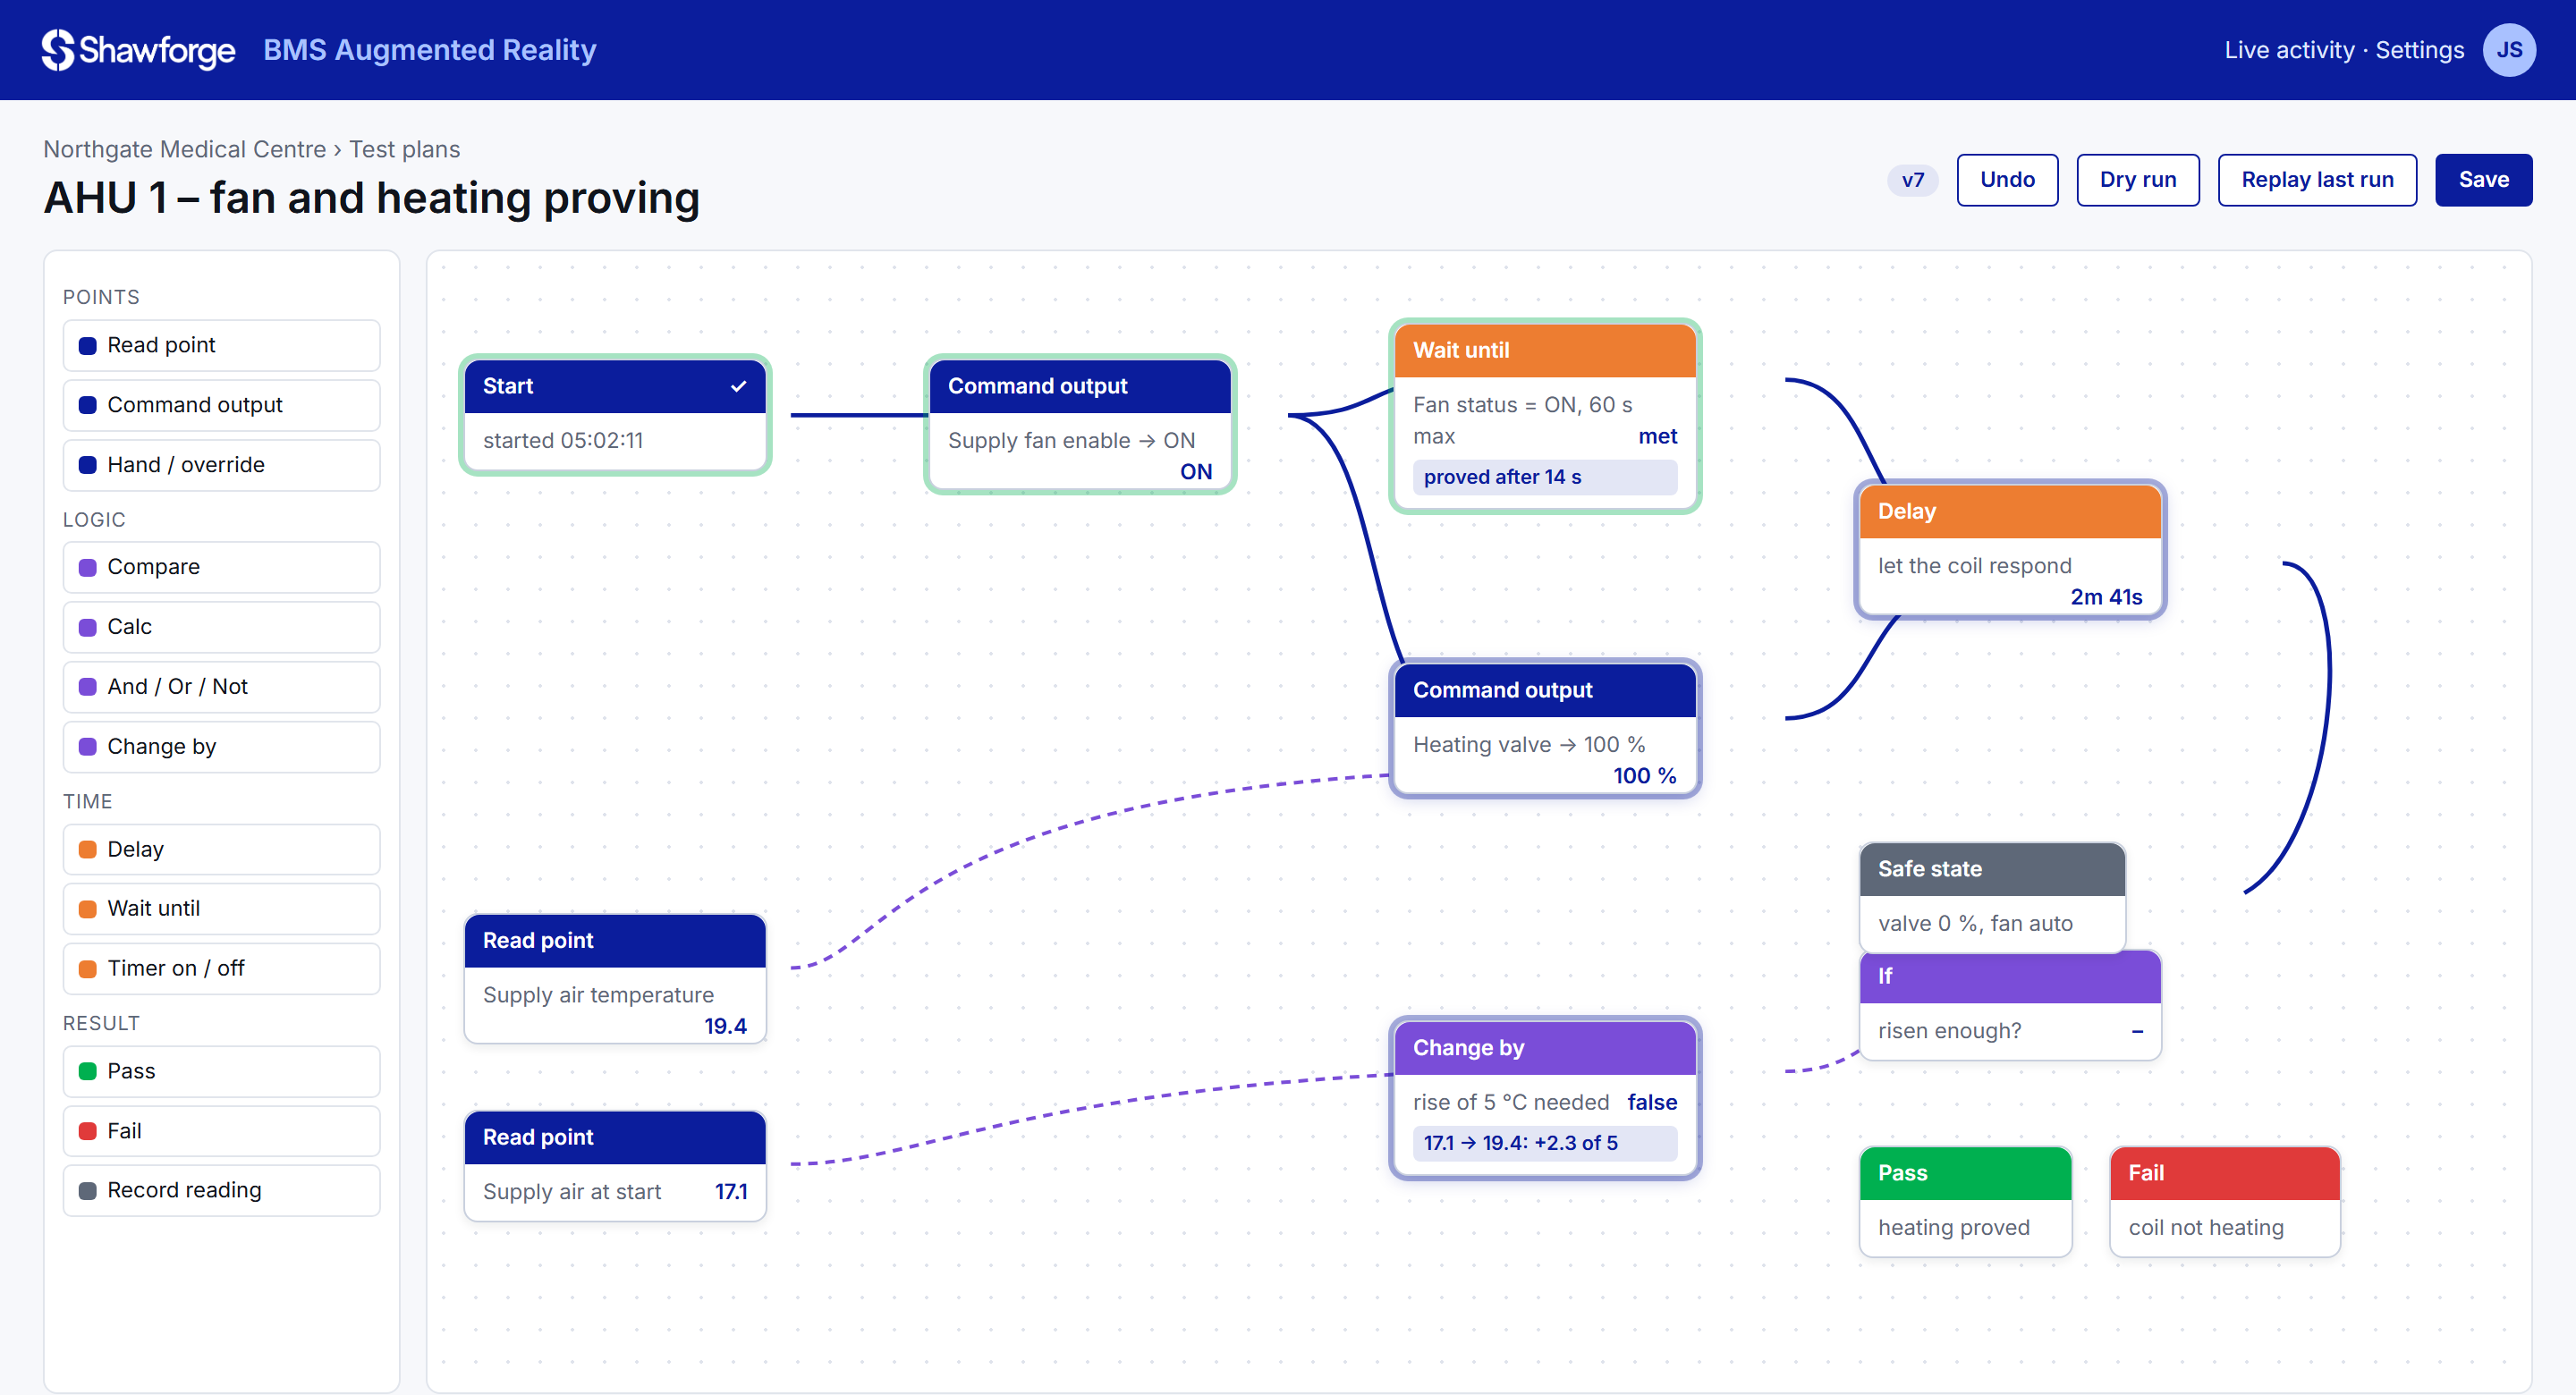
Draw a test plan for each item of plant with blocks and wires: command an output, wait for the right response, compare readings, then pass or fail. Plans on different plant run side by side; a run can be scheduled overnight and watched live, block by block.
Every Remote PPM ends with a report – PDF and Word – emailed automatically. Results are written in plain English, saying not just what failed but where the fault probably lies: the plant, the wiring, or a manual override left on.
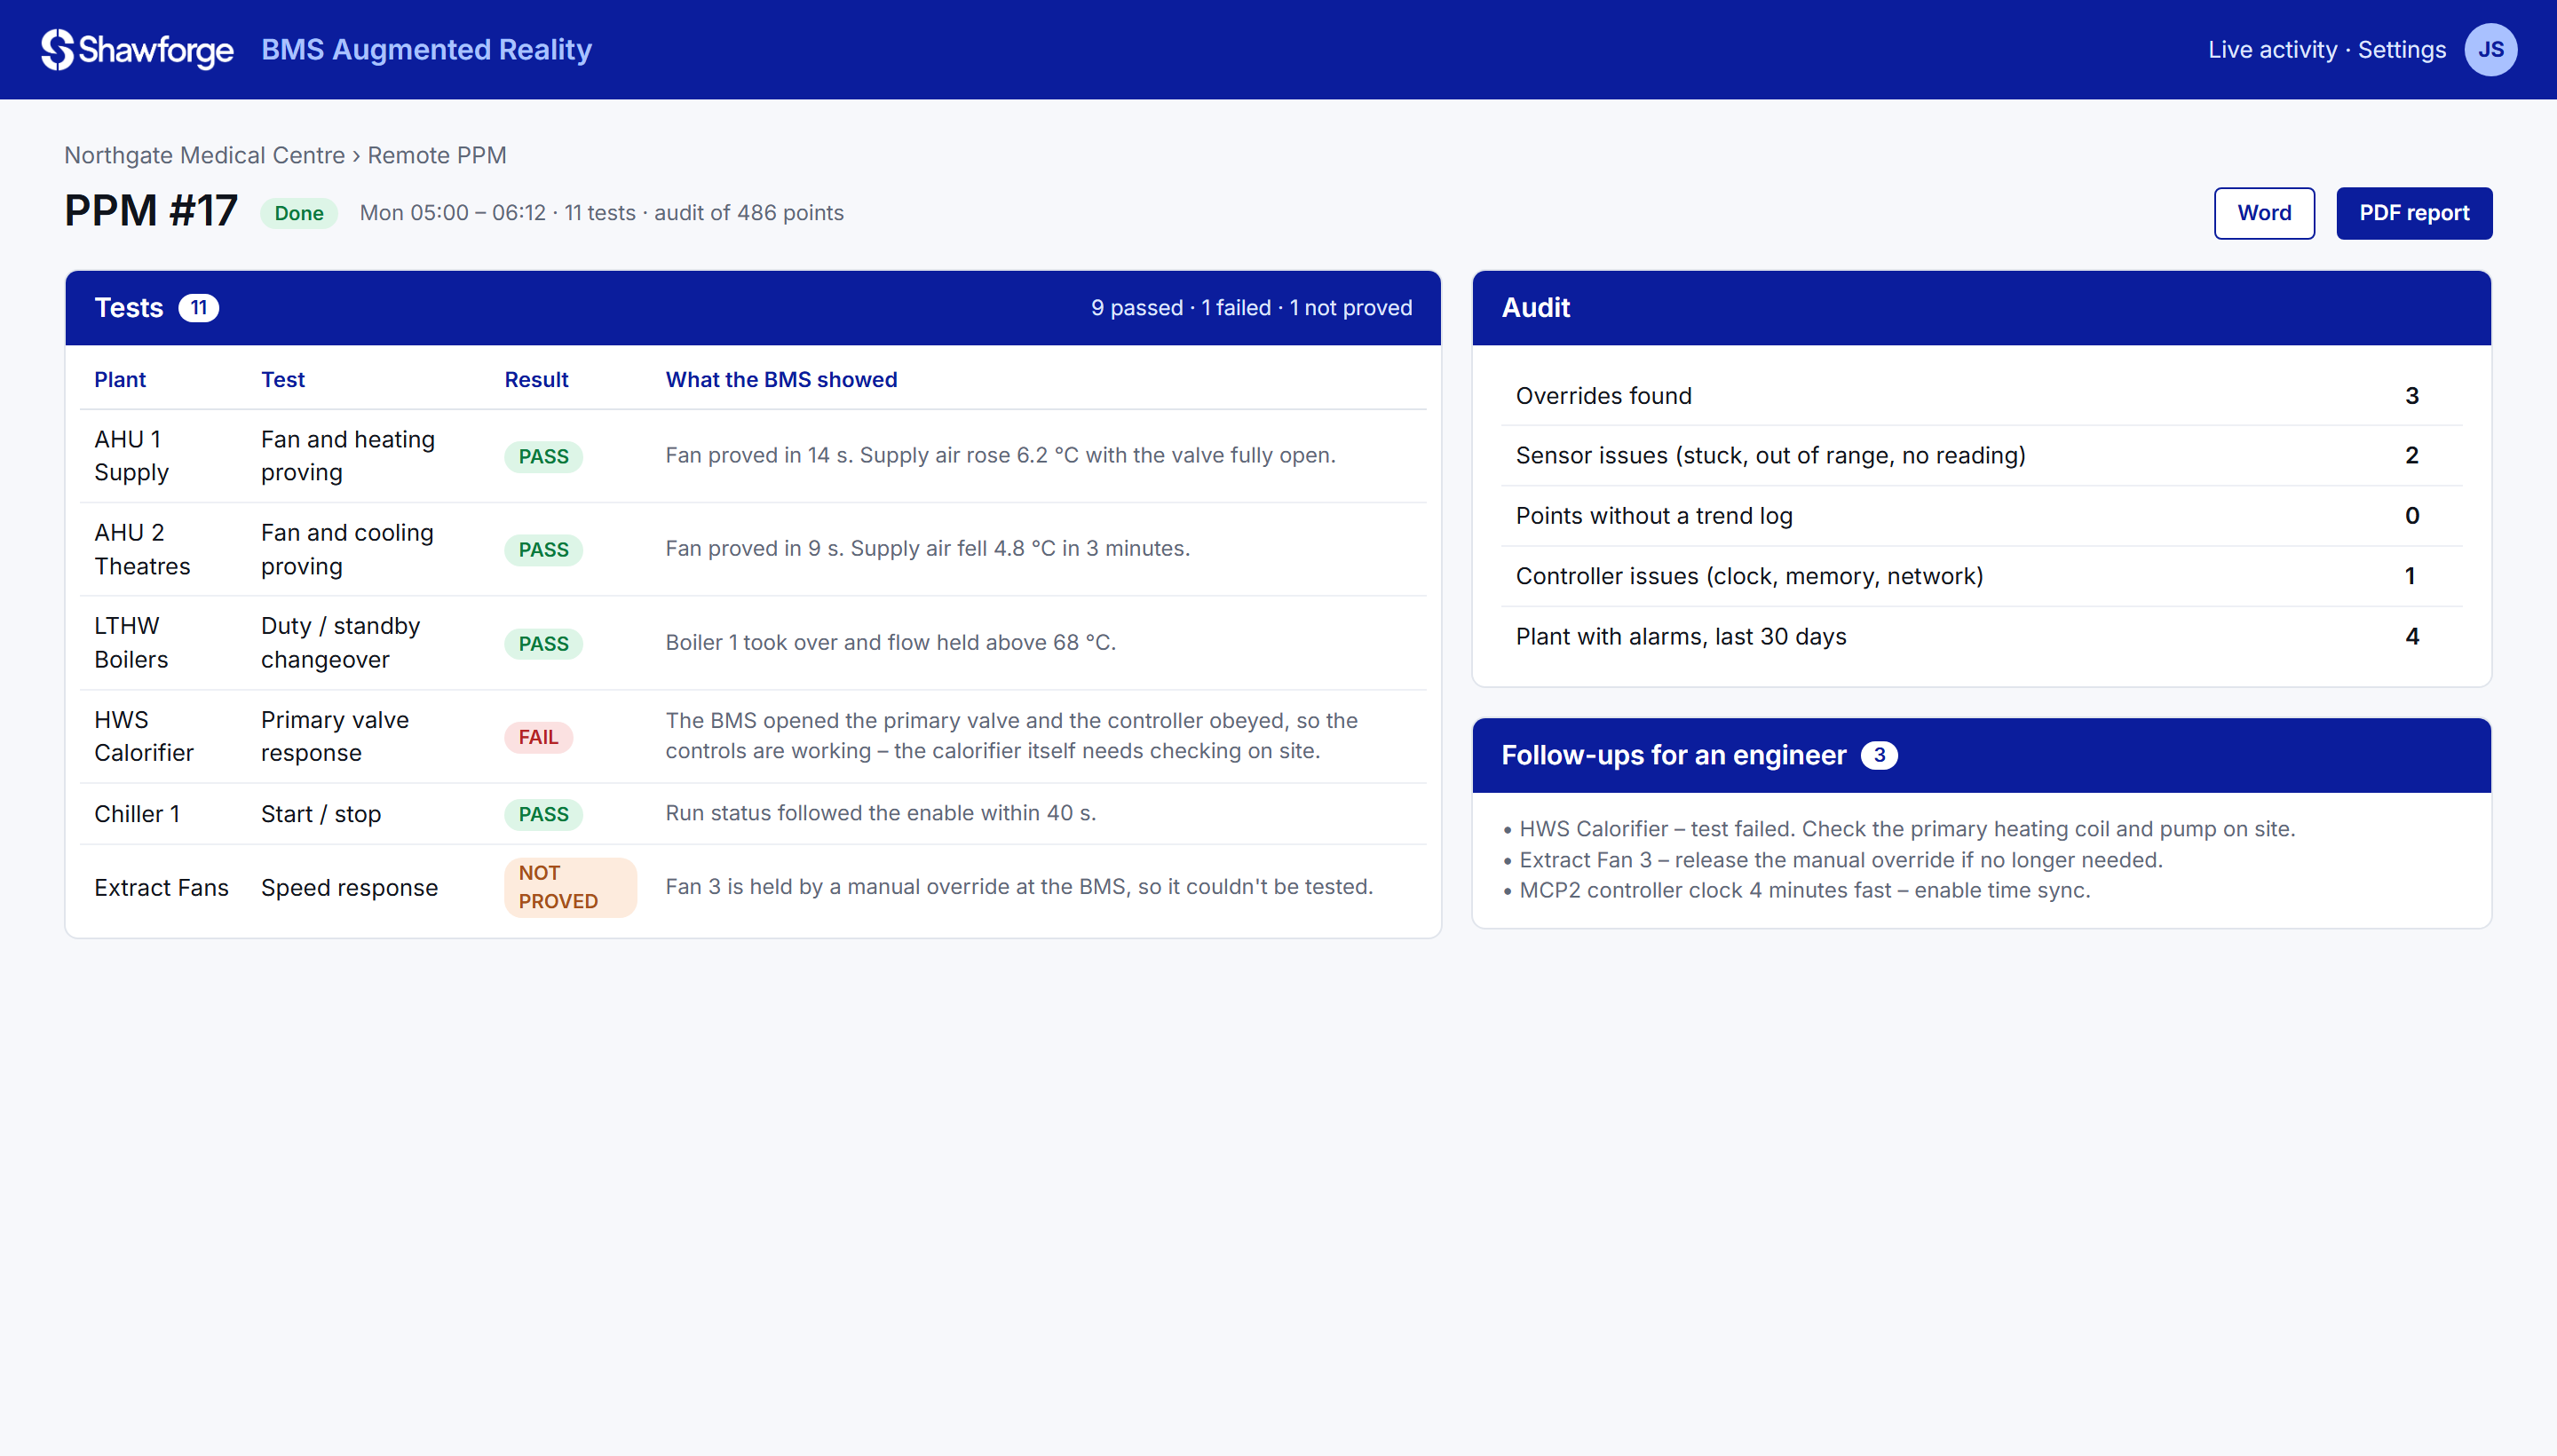
Alarms and client emails become incidents with the site's history and known facts at hand – which units are third-party, who's responsible for parts – so replies are right first time.
Where it's safe, common lockouts are reset automatically and the outcome recorded; anything that recurs is raised for an engineer instead.
Faults arrive with clearly coloured trend graphs and named axes, so the cause is visible before anyone opens a laptop.
One library of manufacturers' documents and a part-code index, kept in sync between servers and shared with Studio.
Themes, logos and colours for your company, carried through the console, the phone app and every report.
HTTPS and encrypted MQTT, per-site access, an audit trail of every change and nothing written to live plant without your rules.
We'll connect a site, tag a few items of plant and show your team the phone app working on the real thing.